
Find answers to the most common questions.
hScore rates the investment attractiveness of a stock, ETF, mutual fund, or portfolio. It's a custom rating prepared specifically for your portfolio based on its goals and priorities for return, safety, and income potential.
hScores range from 0 to 1000, with higher scores indicating greater attractiveness for your portfolio.
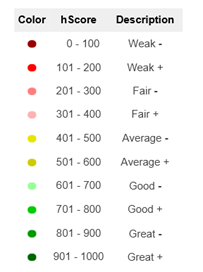
Return, Safety, and Income (abbreviated as RSI) Scores rate a specific attribute of a stock, ETF, mutual fund, or portfolio.
Unlike hScores, which are custom ratings for each portfolio, RSI Scores are standardized and the same for all portfolios. Like hScores, RSI Scores range from 0 to 1000, with higher scores indicating greater potential.
Like hScores, RSI Scores range from 0 to 1000, with higher scores indicating greater potential.
Your portfolio's priority weights indicate the relative importance of the potential for Return, Safety, and Income in your portfolio.
These priorities are expressed in percentages that always add up to 100%. You set these values in your portfolio settings.
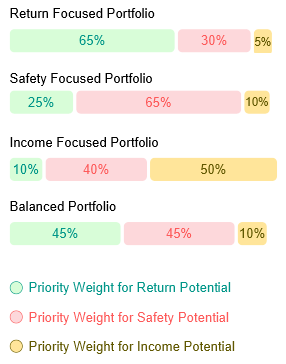
Examples of portfolio priority weights:

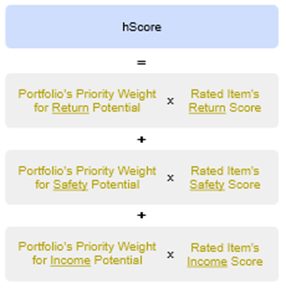
hScores are calculated as a weighted average of the Return, Safety, and Income Scores of the item being rated (e.g. stock, ETF, mutual fund, or portfolio).
The weights used are your portfolio's priority weights for Return, Safety, and Income potential, ensuring all hScores are customized to your portfolio.
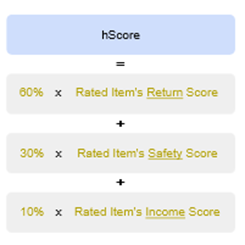
For example, if your portfolio has priorities of 60% for Return, 30% for Safety, and 10% for Income, all hScores for this portfolio are calculated using the formula:
Scores help you make informed portfolio decisions by serving as a single metric to evaluate, manage, and track your portfolio.
Return Score rates a stock's, ETF's, mutual fund's, or portfolio's return potential in rising stock market conditions.
Like hScores, Return Score ranges from 0 to 1000, with higher score indicating greater return potential.
Unlike hScores, which are custom ratings for each portfolio, Return Score is standardized and the same for all portfolios.
Safety Score rates a stock's, ETF's, mutual fund's, or portfolio's return potential in falling stock market conditions.
Like hScores, Safety Score ranges from 0 to 1000, with higher score indicating greater return potential.
Unlike hScores, which are custom ratings for each portfolio, Safety Score is standardized and the same for all portfolios.
Income Score measures a stock's, ETF's, mutual fund's, or portfolio's potential to generate dividends under any market conditions.
Like hScores, Income Score ranges from 0 to 1000, with higher score indicating greater potential to generate dividends. Investments that don't pay dividends are rated zero.
Unlike hScores, which are custom ratings for each portfolio, Income Score is standardized and the same for all portfolios.
Our analyst team was inspired by how scientists mix Red, Blue, and Green colors in different proportions to create any color.
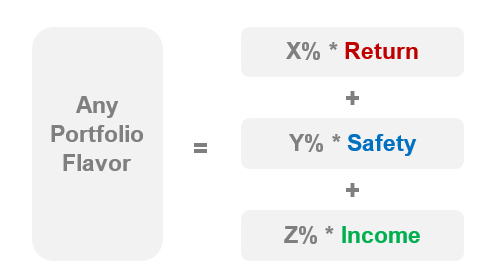
Using this color analogy, we developed the RSI (Return, Safety, Income) framework for portfolio priorities.
This framework allows for creating any “portfolio flavor” by adjusting the proportions of Return, Safety, and Income potential.

In this framework, the percentages for Return (X), Safety(Y) and Income(Z) always add up to 100%, capturing the trade-offs between these three conflicting priorities.
Calibrate your portfolio's priority weights using the these two steps:
Adjust your priority weights until you're satisfied with how your custom S&P 500 portfolio performs relative to the actual S&P 500 over the last 10 years.
